HERE Mapathon
Took home 2nd place and $5k in a map-based data visualization competition against over 800 teams from around the globe
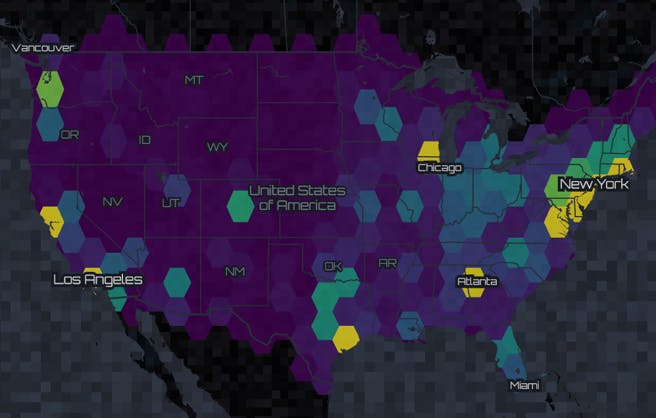
I took data from the US Census Bureau on income & commute time by geography and combined them to come up with a dollar value for the time lost to commuting.
I used 3 different granularities of geographic region, Zip Codes, Counties, & Metro/Micropolitan areas to serve different zoome levels of the map.
Technologies used
- Mapshaper
- Python with Pandas
-
- Data Hub
- CLI
- Space Invader
- Tangram
- Leaflet.js
- Svelte
Data used
- US Census Bureau American Community Survey (2017 5 year estimate)
- Bureau of Labor Statistics
