Pacific Northwest Predictive Current Map
NOAA provides wonderful predictions of sea current strength & direction at many stations around the Puget Sound (and rest of the US), but they don't do the best job of presenting the data in a consumable form. I took their data & built an improved experience around it.
Because the Salish Sea (which includes the Puget Sound) is an inland ocean, it has a lot of water moving in and out of it every day as the tides rise and fall. This results in relatively intense & variable currents depending on the topography of the earth & depth.
Last year I went on a paddling trip in the Puget Sound and wanted to be sure that we wouldn't get swept away or be fighting currents the enitre time.
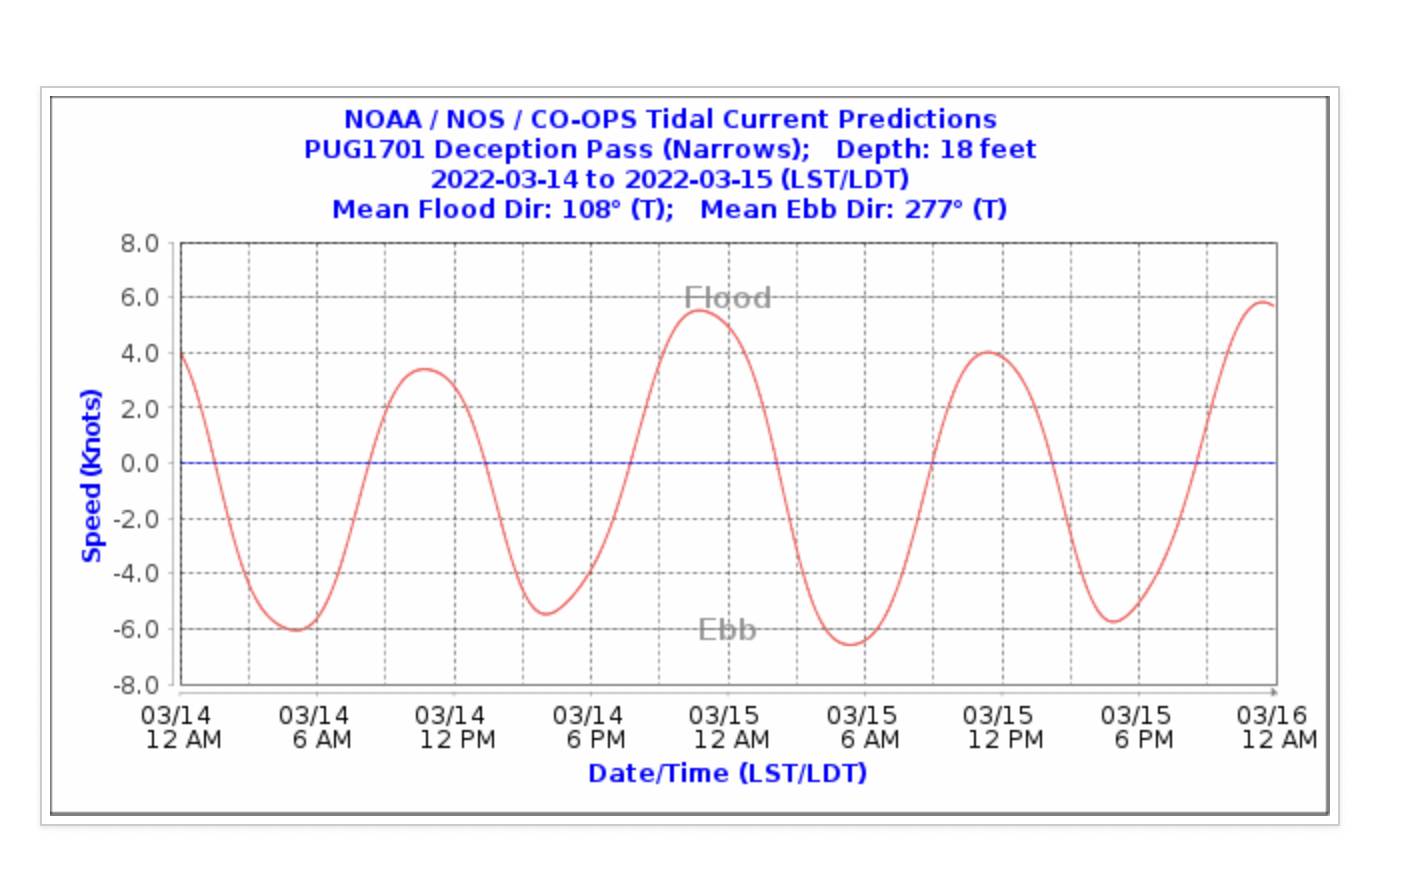
NOAA provides super cool predictions of sea current strength & direction at many stations around the Puget Sound (and rest of the US), but they don't do the best job of presenting the data in a consumable form. You can only look at the predictions for a single station at a time:
At the sugestion of my partner, Angela, I decided to take their data & present it in a somewhat more usable form. I pull the data for many stations at once and plot the strength & direction of the currents on the map at once:
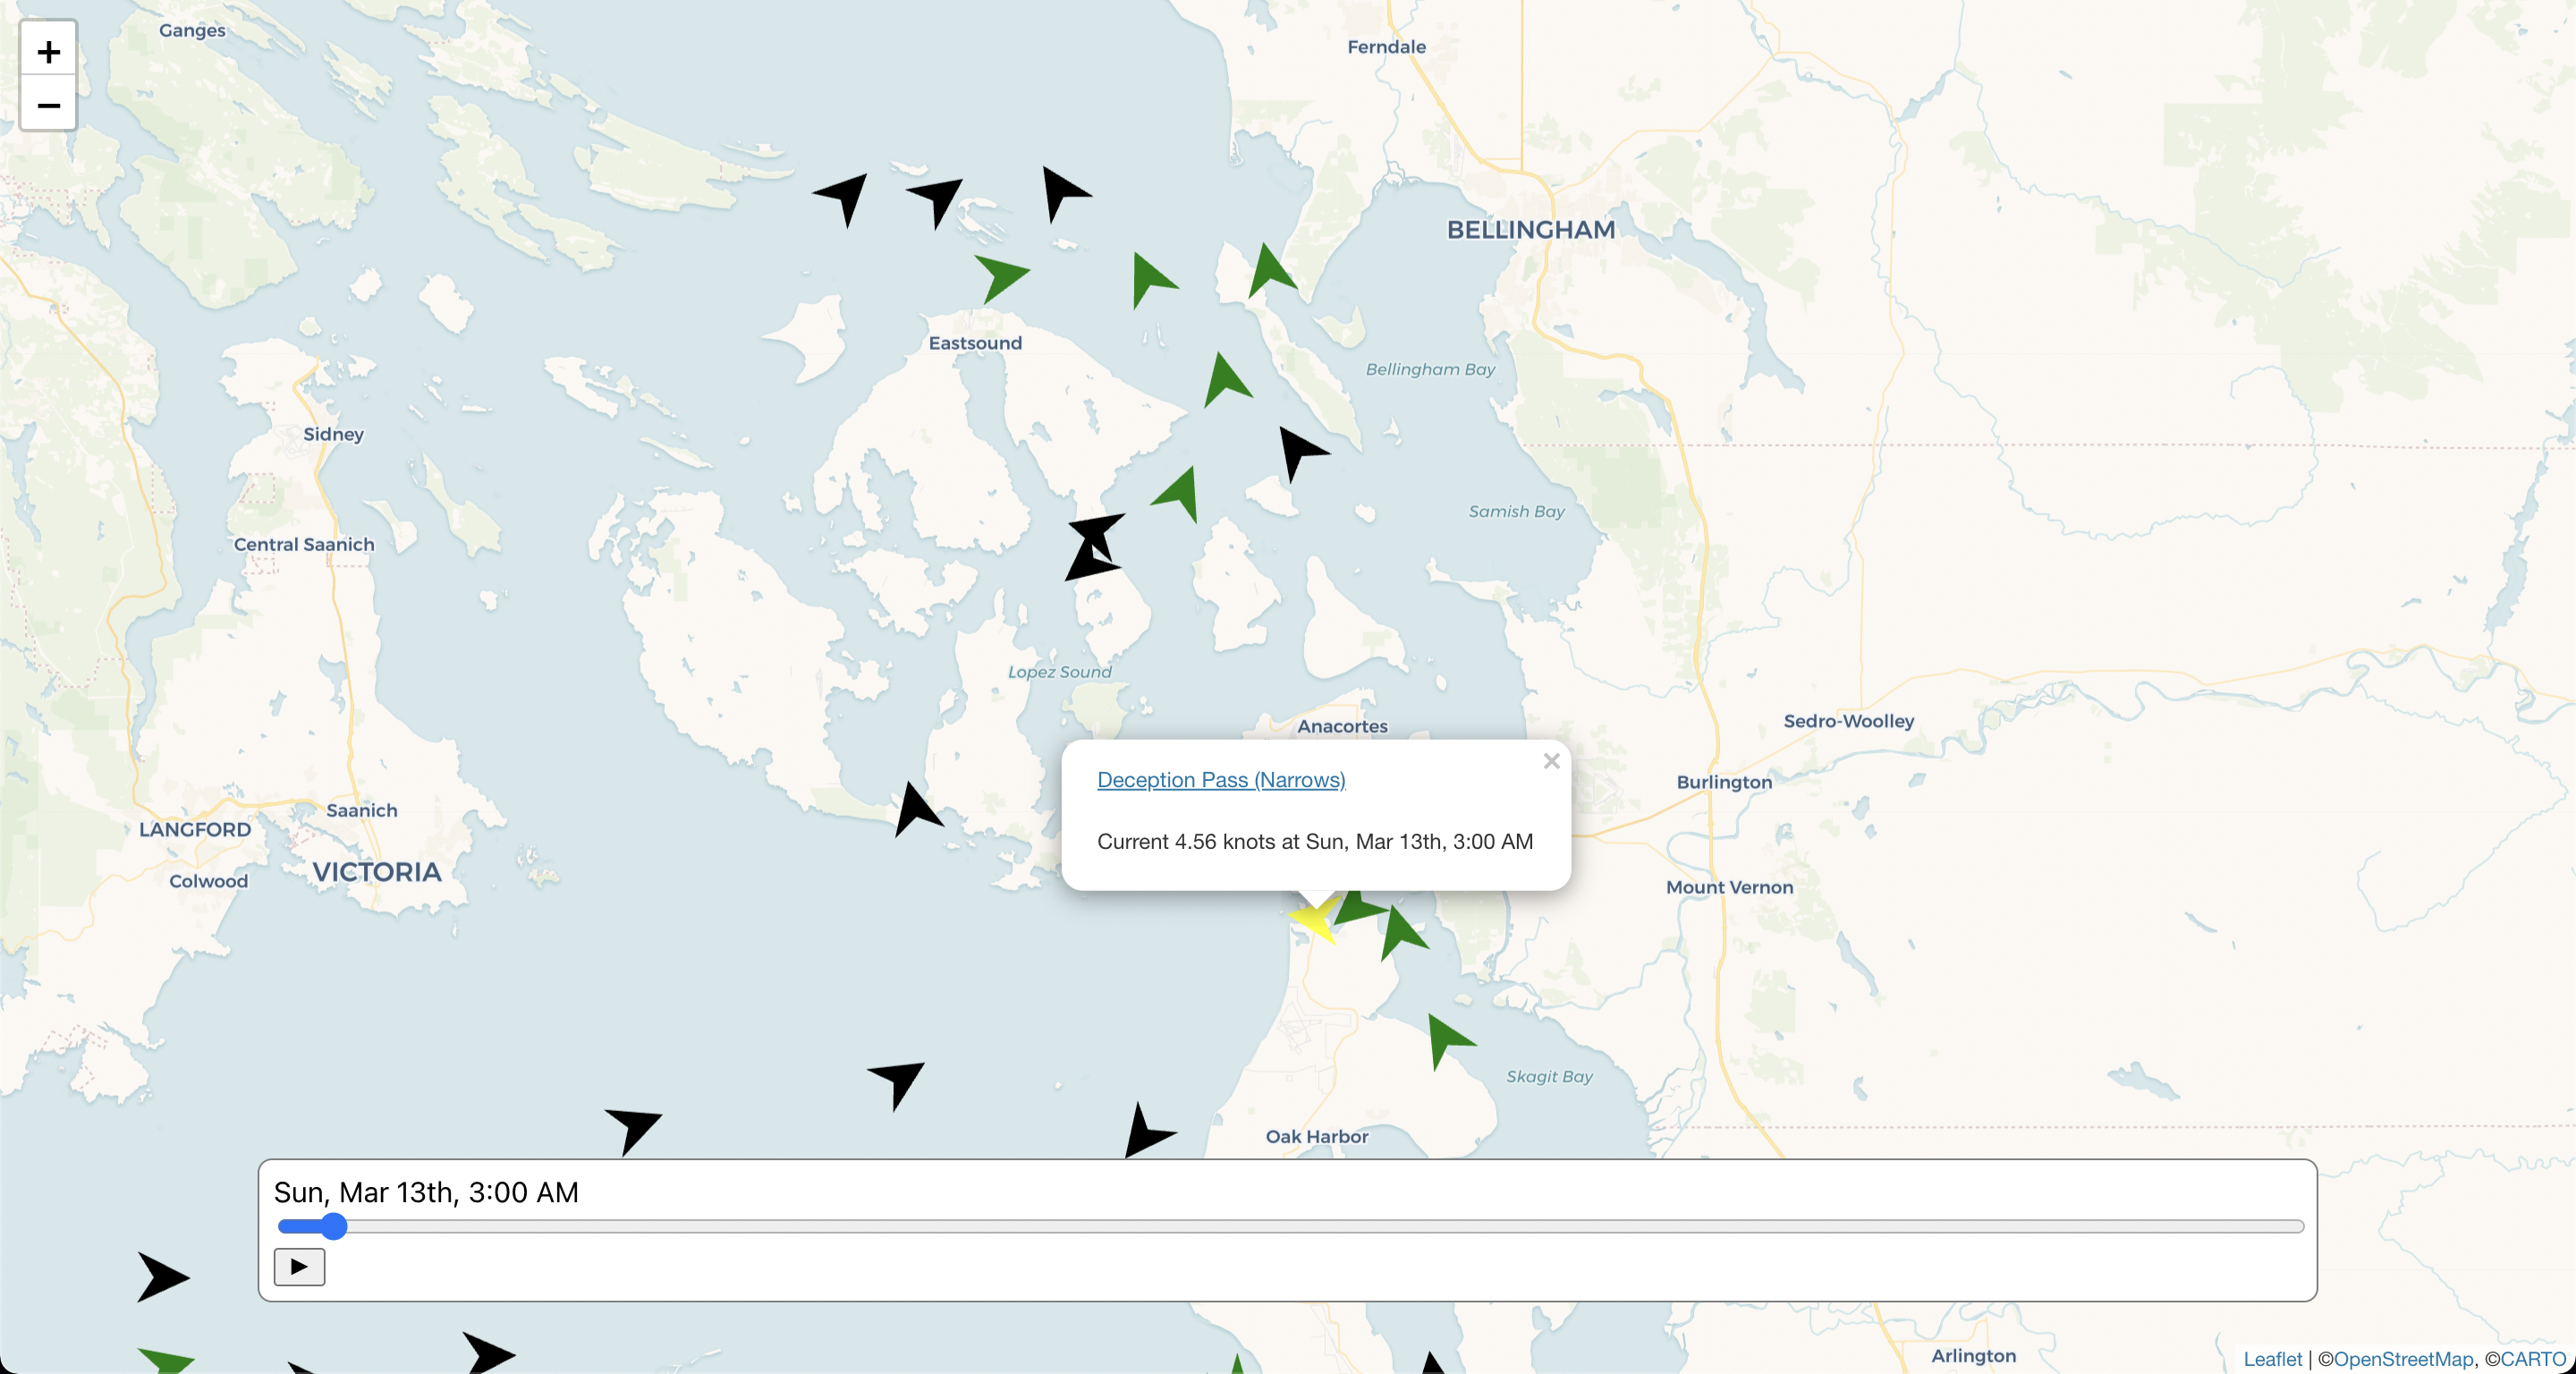
I've included a time scrubber, so the user can look at what the currents will be doing over time.
This data is sure to be useful for open water swimmers, stand up paddlers, kayakers sailors & other types of boaters.
It currently only shows a subset of stations (to avoid overloading the NOAA API), but I'll update it to include more stations & even other regions of the US when I have time.
Technologies used
- React - frontend
- Leaflet - mapping
- Netlify - static hosting
- Node.js - backend code
- Express - simple server side framework
- Railway - backend host
